This post will show you how to include GIFs in a blogdown post from a website, and how to make new GIFs from R plots (base R and ggplot2) using knitr chunk options.
Embed GIFs from a link
You can add a link to any GIF online, from sites like giphy, using markdown syntax in either .md or .Rmd posts. For example, to embed this GIF:

You would find the GIF online, then click on “Copy Link”, and select the “GIF Link” to copy:
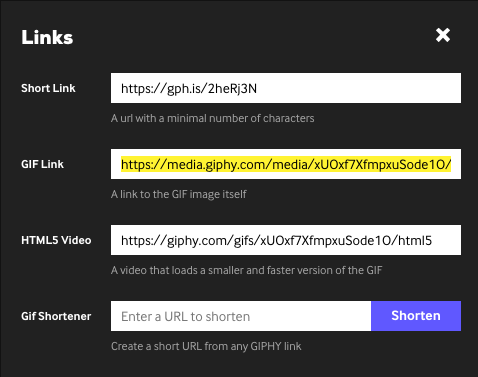
Then use markdown to refer to that link in the plain text of your post (not an R code chunk):
Embed plot GIFs using R
To create a GIF animation of a plot made in R, you need to install FFmpeg on your computer. If you are on a macOS, you can install FFmpeg through Homebrew using the formula brew install ffmpeg.
You can make a GIF animation using knitr starting in version 1.15. A GIF animation of the plots in a code chunk will be generated for HTML output when you use the chunk options fig.show = 'animate', ffmpeg.format = 'gif', and dev = 'jpeg'.
Here is an example knitr chunk with options:
```{r chunk-label, fig.show='animate', ffmpeg.format='gif', dev='jpeg'}
for (i in 1:10) plot(runif(100), ylim = c(0, 1)) # for example
```
Which would produce the GIF below…
Let’s break those chunk options down:
fig.show = 'animate': how to show/arrange the plots;animatewraps all plots into an animation if there are mutiple plots in a chunkffmpeg.format = 'gif': the filename of the extension video you want to create. This.giffile is also saved in your/static/post/directory.dev = 'jpeg': the function name which will be used as a graphical device to record the individual plots that make up the above. These.jpegfiles are each saved in your/static/post/directory.
You can also create GIFs using the purrr and ggplot2 packages.
library(purrr)
library(ggplot2)
library(repurrrsive) # for the example data below
Below is some sample code from an awesome purrr tutorial by Charlotte Wickham. From her map2() example code:
gap_split_small <- gap_split[1:10]
countries <- names(gap_split_small)
# For all countries
plots <- map2(gap_split_small, countries,
  ~ ggplot(.x, aes(year, lifeExp)) +
      geom_line() +
      labs(title = .y) +
      coord_cartesian(ylim = c(0, 100)))
To show these plots as an animation, we would use this code chunk:
```{r gapgif, fig.show='animate', ffmpeg.format='gif', dev='jpeg'}
# Display all plots
walk(plots, print)
```
Which produces the GIF below…